Nasdaq 100 and S&P 500 indices often take the spotlight when contemplating investment in the US equity markets, especially through mutual funds. This is likely because the Nasdaq 100 Index and S&P 500 Index are two of the most established and extensively tracked benchmarks within the realm of US equity markets.
While both the Nasdaq 100 and S&P 500 indices mostly include big companies, but they are still a bit different in how they are made up. Even though they have some of the same top companies, the number of included companies, their weightings, and sector allocations diverge significantly. As a result, their performance can vary over time.
Therefore, traders seeking to invest funds into either of these indexes must possess a comprehensive comprehension of these two widely recognized indexes.
In this article, we delve into exploring the shared traits and distinctions of these indexes, conducting a performance comparison, and also discussing the trading aspects of E-mini Nasdaq 100 and S&P 500 Futures.

What is Nasdaq 100 Index?
The Nasdaq-100 index is a stock market index that represents the performance of the 100 largest non-financial companies listed on the Nasdaq Stock Exchange.
This index is known for its focus on technology and innovation-driven companies, making it a key benchmark for tech-heavy sectors. One of its top holdings is typically Apple Inc., a global leader in consumer electronics.
Beyond technology, the Nasdaq 100 includes companies from various sectors like consumer services, healthcare, and communication services. This diversified mix offers investors exposure to a range of industries while emphasizing the technology sector’s significance.
According to Slickcharts.com, here are the top 10 companies from the Nasdaq 100 companies list and their weightage to the index, as per 30th August 2023.
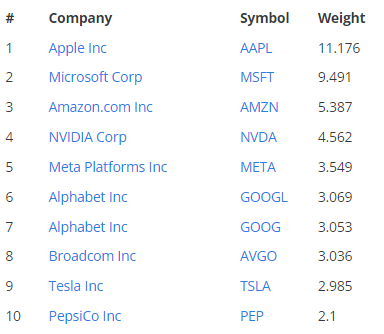
Figure 1. The top 10 companies from the Nasdaq 100 list of companies and their weightage to the index, as per 30th August 2023.

What is S&P 500?
The S&P 500 Index, or Standard & Poor’s 500 Index, is a stock market index that represents the performance of 500 of the largest publicly traded companies in the United States.
This index offers a comprehensive view of the overall US stock market, encompassing a diverse array of industries. Its constituents include companies from sectors such as technology, healthcare, finance, and consumer goods.
With a focus on market capitalization, the S & P 500 is weighted by the size of each company, meaning that larger companies have a bigger influence on the index’s movements. As a result, the S&P Index serves as a fundamental measure of the health and trends of the US economy.
According to Slickcharts.com, here are the top 10 companies from the S&P 500 companies list and their weightage to the index, as per 30th August 2023.
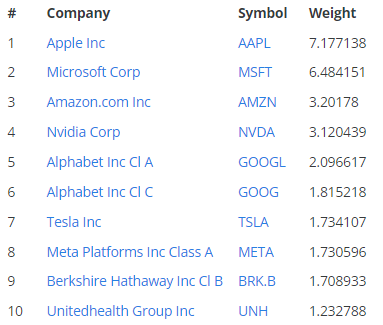
Figure 2. The top 10 companies from the S and P 500 companies list and their weightage to the index, as per 30th August 2023.

What is the difference between S&P 500 and Nasdaq-100?
Although both the S&P 500 and Nasdaq 100 Indexes represent the performance of the top companies in the United States, however, there are still some differences between the two indexs.
1. Composition and Focus
The S&P 500 and Nasdaq 100 both possesses its distinct composition and focus. The S&P 500 encompasses an extensive array of 500 of the largest publicly traded companies in the United States. On the other hand, the Nasdaq 100 is meticulously curated to spotlight the 100 largest non-financial companies listed on the Nasdaq Stock Market.
This divergence in the number of companies considered results in the S&P 500 Index offering a more comprehensive view of the American economy, including companies across diverse sectors such as finance, healthcare, and consumer goods.
In contrast, the Nasdaq-100 takes a notable stance in the realms of technology, innovation, and internet-driven sectors. As such, it serves as a benchmark that uniquely captures the performance of these dynamic and cutting-edge industries.
2. Weighting Methodology
Another notable distinction between the two indices lies in their weighting methodologies. The S&P 500 employs a traditional market capitalization-based approach, where companies’ weights are determined by their market values. This means that larger companies carry more influence on the index’s overall performance.
In contrast, the Nasdaq 100 follows a modified market capitalization-weighted methodology, which places a cap on the maximum weight that any single company can have within the index. This approach prevents the index from being disproportionately swayed by the performance of a few dominant companies.
3. Top Holdings and Sector Concentration
The top holdings of the S&P 500 typically encompass a diverse range of sectors, reflecting a broader representation of industries within the index. These holdings include companies from various sectors, offering a well-rounded view of the overall market.
Conversely, the Nasdaq 100’s top holdings are often dominated by technology giants like Apple, Amazon, Microsoft, and Alphabet. This concentration of leading tech companies underscores the Nasdaq-100’s strong focus on the technology and innovation sectors. As a result, the performance of these technology giants plays a significant role in shaping the index’s overall movement and trends.
Is the Nasdaq better than the S&P 500?
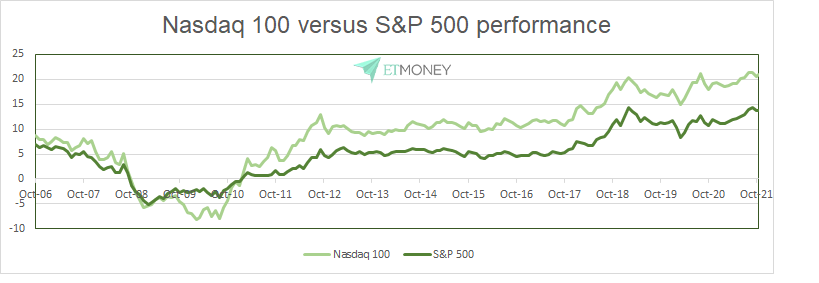
Figure 3. Comparison of Performance Between Nasdaq 100 and S&P 500 from ET Money.
According to ET Money, the Nasdaq 100 has displayed a remarkable performance advantage over the S&P 500. Over the course of the past 15 years, the Nasdaq 100 has achieved a Compound Annual Growth Rate (CAGR) of around 16%, significantly outpacing the S&P 500’s return of approximately 8%.
In the first half of 2023 alone, Nasdaq reported that the Nasdaq-100 index concluded with an impressive gain of 39.4%, surpassing the S&P 500’s gain of 16.9%. This marks the most promising start to the year for the Nasdaq-100 since its inception in 1985, further perpetuating the enduring trend of outperformance dating back to 2009.

Is it better to invest in S&P or Nasdaq?
Although the data shown that Nasdaq 100 performed better than the S&P 500, however it is important to note that each indexes their own unique strengths within the landscape of stock market indices.
The Nasdaq 100’s standout feature lies in its focused representation of technology and innovation-driven sectors, allowing traders to track the performance of leading tech companies.
On the other hand, the S&P 500’s strength lies in its comprehensive inclusivity, spanning a broad spectrum of industries and sectors. This diversity offers investors a holistic view of the American economy, making the S&P 500 a reliable barometer for overall market trends and economic health.
Both indices bring unique strengths to the table, catering to different investment preferences and providing valuable insights into distinct facets of the stock market.
Trading E-Mini Nasdaq 100 Futures & E-Mini S&P 500 Futures
For traders seeking alternatives to investing in index funds, the Chicago Mercantile Exchange (CME) provides a range of E-mini Nasdaq 100 and E-mini S&P 500 contracts, including futures, options, and week options.
Traders can trade these contracts through Orient Futures Singapore, offering international traders access to products around the clock, 24/5.
E-Mini Nasdaq 100 Futures
The E-mini-Nasdaq-100 Futures have the following contract specifications:
The Futures Contract has a contract unit of $20 x Nasdaq- 100 Index with a minimum price fluctuation of 0.25 index point/$5.00 outright.
Contract months are quarterly on March, June, September, and December.
The last trading day of the contract month is the third Friday of the contract month.
Chicago Board of Trade trading hours are from Sun to Friday, at these trading hours:
5:00pm – 4:00pm (Settles 3:00p.m.) CST
E-mini Nasdaq-100 Index Futures symbol: NQ
E-Mini S&P 500 Futures
The E-mini S&P Futures have the following contract specifications:
The Futures Contract has a contract unit of $50 x Nasdaq- 100 Index with a minimum price fluctuation of 0.25 index point/$12.50 outright.
Contract months are quarterly on March, June, September, and December.
The last trading day of the contract month is the third Friday of the contract month.
Chicago Board of Trade trading hours are from Sun to Friday, at these trading hours:
5:00pm – 4:00pm (Settles 3:00p.m.) CST
E-mini Nasdaq-100 Index Futures symbol: ES
Start Trading With Orient Futures Singapore
Being an Overseas Intermediary of Shanghai International Energy Exchange (INE), Dalian Commodity Exchange (DCE), and Zhengzhou Commodity Exchange (ZCE), when foreign clients participate in internationalised futures contracts in these Chinese markets with us, they have direct access to trading, clearing, and settlement. Our parent company, Shanghai Orient Futures, is the largest broker in terms of aggregated volume across the five regulated exchanges in China.
Orient Futures Singapore also currently holds memberships at the Singapore Exchange (SGX), Asia Pacific Exchange (APEX), and ICE Futures Singapore (ICE SG). Starting August 2023, corporate clients can also gain access to the B3 Exchange through us.
We provide bespoke services to our professional clients, tailored to their corporate and individual needs. Our team will be there for you 24 hours on trading days to provide a one-stop portal for all your trades, with simple processes and an intuitive user interface that has low or near-to-zero latency.