Corn is among the major feed grains, together with sorghum, barley, and oats. It is the foremost US feed grain, making up over 95% of total feed grain production. Much of this is used in livestock feed, but it is also made into food and industrial products, such as starch, sweeteners, corn oil, beverage, and industrial alcohol. In fact, 40% alone is dedicated to fuelling ethanol.
1. Corn is Equally Produced by Several Countries
The Asia-Pacific corn market projects a compound annual growth rate (CAGR) of 4.3% between 2020 to 2025. Its increase was also due to the growth of the livestock industry (i.e., cattle, poultry) and the commercial animal feed sector. This rise in demand correlates with the growth of the corn market.
Subsequently, while China, India, Indonesia, and the Philippines are Asia’s largest producers, the increase in demand led to trade deficits, prompting the need to import the crop. Therefore, governmental policies to boost corn production have been put in place to boost the market growth.
From the U.S. (the largest producer of corn), the Russian-Ukraine conflict has led to an increase in the price of futures for wheat and soybeans, and it was recorded to reach record highs earlier in 2022, the highest level in more than a decade.
From USDA and bar chart, it was reported that corn shipments were 667,010 MT for the week that ended 12/29. That was down from 922k MT last week and down from 760k MT during the same week last year.
Overall, it is expected that global corn markets may face a corn shortage in the first quarter of 2023. From Argus Media, it is reported that for the corn demand, some countries will turn to the US for exports, while the EU is at a greater risk of a supply shortage due to its high dependency on Brazil and Ukraine for corn supply.
2. Highly Liquid Agricultural Futures Products
Corn is the most liquid and active agricultural option on the market today, averaging over 350,000 contracts per day. Global participants include individual traders, investors, commercial firms, grain elevators (facilities), and farmers.
Among the contracts, dec 22 corn futures and dec 23 corn futures contracts are some of the most popular. Traders often choose the “front” month, which is typically the most active month for futures and options contracts, or certain months where harvesting is increased or decreased, which affects the prices accordingly.
3. CME and CBOT
Corn Futures contract is mainly traded from the Chicago Board of Trade (CBOT/CME), though it is also available from New York Stock Exchange Euronext (NYSE) and Tokyo Grain Exchange (TGE).
“March Corn Futures settled at a one-week low of 670’4 Tuesday, off 8’0 (1.18%). Across all maturities, volume was 262,923, with the March maturity seeing 155,538 trades. Total open interest added 6005, or 0.49%, with March losing 11,088 (1.98%) to 548,590.”
-CMEgroup.com
4. Factors Affecting Corn
Corn trading is affected by a large range of factors including, weather, seasonality, export demand, projected crop size, ethanol demand, and USD exchange rates.
Among these reasons, the Ukraine and Russian conflict has resulted in an impact on harvests, significantly restricting supply side production. From SPglobal, it was reported that even if “Brazil has a bountiful harvest, the problems with Ukraine, the EU, and the US will mean that 2-3 years of good harvests globally will be needed before some sense of normalcy returns”.
Previously in 2022, early corn planting was in September, however, the lack of sufficient rainfall forced farmers to delay planting this season. The crop is usually done in April-May, while the late-corn crop is sown in December-January and harvested in June-July.
Currently, USDA is projecting a 125 million bushel increase in corn exports for 2023, reversing the trend of lower international sales over the past couple of years.
5. Corn Futures Prices
CME group places Corn as one of the top five commodity futures with an average trading volume of 304,986 and an open interest of 1,323,449. Based on records from Capital.com, though corn prices have fallen, the grain did not fall below $2.00, gaining 24.8% over the year. Corn continued to rise in 2021 on rebounding demands as economies gradually reopened. Us corn futures gained about 22% over the course of 2021.
*Night Session Commodities Market (As of 02:30 am)
Table 1: Source: Orient Futures Singapore
The above are the corn futures price with corn as a top gainer of the session as of 5th January 2023.
Table 3: Source: MarketWatch: Dec 23 Corn Futures
| Product | Contract | Price | Change % | Trading Volume | Open Interests |
|---|---|---|---|---|---|
| Corn | C2303 | 2,881.0 | +0.63% | 136,489 | 716,251 |
The above are the corn futures price with corn as a top gainer of the session as of 5th January 2023.
Table 3: Source: MarketWatch: Dec 23 Corn Futures
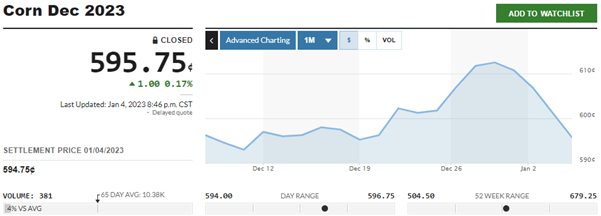
The above is the corn dec 2023 futures price.
How To Trade Corn Futures
Orient Futures Singapore is a licensed brokerage that will enable traders to engage in futures trading for products such as corn futures from CBOT (merged with Chicago Mercantile Exchange in 2007), as well as many other exchanges. The benefits of trading with us include a simple fee structure, full online registration and trading, and access to global markets as well as China markets.
Other benefits include:
- No paperwork, 100% online registration and trading activity
- Access to global markets due to exchange connectivity and ultra-low latency
- Direct access to China capital markets
- Real-time trade and account information
- 24-hour support on trading days
- Secured funds in regulated banks
By trading corn with Orient Futures, you can diversify your portfolio with commodities and other financial instruments; Traders and investors that are seeking to hedge against adverse price movements can also join in the trading experience.
Start Trading With Orient Futures Singapore
Being an Overseas Intermediary of Shanghai International Energy Exchange (INE), Dalian Commodity Exchange (DCE), and Zhengzhou Commodity Exchange (ZCE), when foreign clients participate in internationalised futures contracts in these Chinese markets with us, they have direct access to trading, clearing, and settlement. Our parent company, Shanghai Orient Futures, is the largest broker in terms of aggregated volume across the five regulated exchanges in China.
Orient Futures Singapore also currently holds memberships at the Singapore Exchange (SGX), Asia Pacific Exchange (APEX), and ICE Futures Singapore (ICE SG).
We provide premium customer service at an affordable cost to all our clients. Our team will be there for you 24 hours on trading days to provide a one-stop portal for all your trades, with simple processes and an intuitive user interface that has low or near-to-zero latency.